
Figure 2.
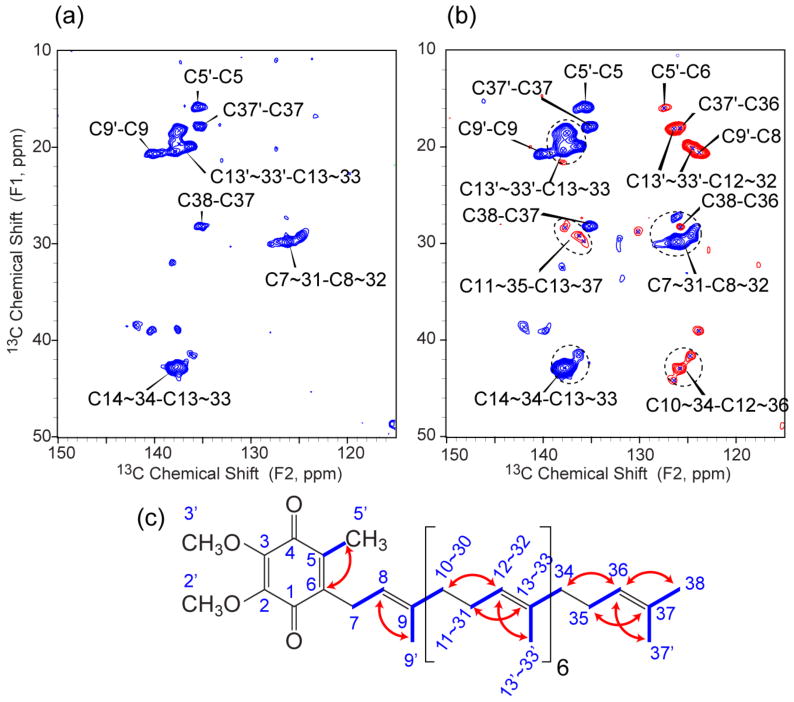
13C-13C DQ spectra of U-DsbB(C41S) at 10.0 kHz MAS with (a) 0.8 ms and (b) 1.2 ms POST-C7 mixing (B0 = 14.1 T, Tsample = −12 °C, 2 s pulse delay, maximum t1 = 10.24 ms, maximum t2 = 20.48 ms). Blue contours represent one-bond correlations and red contours represent two-bond correlations with the opposite sign. (c) UQ-8 structure with highlights of one-bond (blue lines) and two-bond (red arrows) correlations observed in DQ experiments.