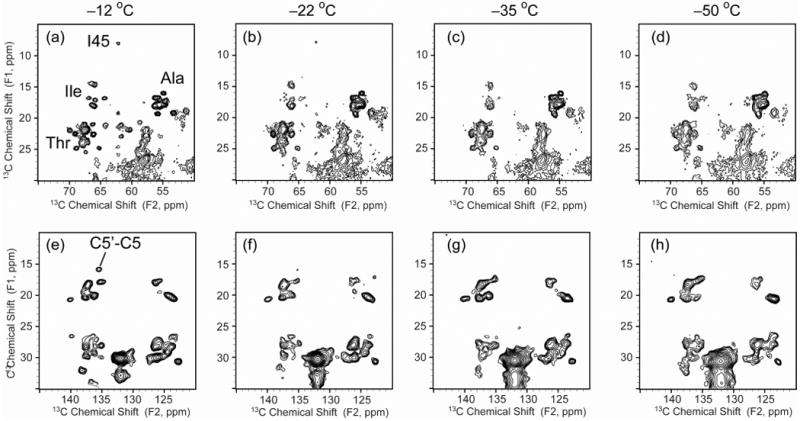
Figure 7.

13C-13C 2D correlation spectra of U-DsbB(C41S) under 12.5 kHz MAS with 25 ms DARR mixing at various temperatures (B0 = 17.6 T, Tsample = −12 ∼ −50 °C, 1.5 s pulse delay, maximum t1 = 15.36 ms, maximum t2 = 20.48 ms). (a-d) Expanded regions with Ala, Ile and Thr crosspeaks at various temperatures. (e-h) Expanded regions with UQ-8 crosspeaks at various temperatures. Signals of residues that are close to the membrane surface get broader linewidths when the temperature decreases (I45, Ala, Ile and Thr in the loop regions, UQ C5′).
