
Fig. 2.
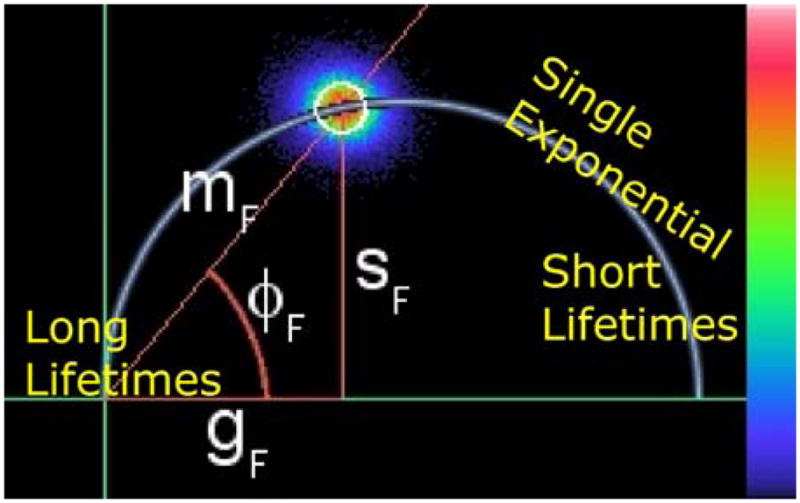
The structure of a phasor plot is shown. Single exponential lifetimes are located on the semicircle, short lifetimes are located near the bottom right intersection with the x axis, and long lifetimes are located near the origin. The data shown is for a bulk measurement of fluorescein.