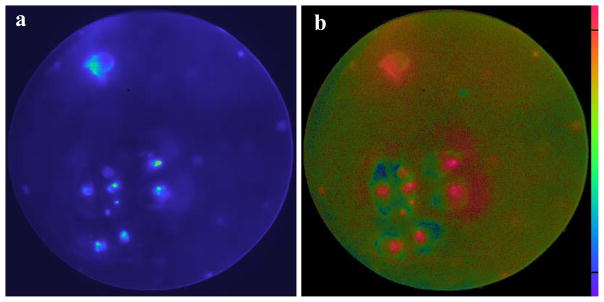
Fig. 6.
H33D data of HeLa cells expressing caveolin 1-EGFP and GPI-anchored avidin labeled with non-biotinylated quantum dots emitting at 620 nm. (a) Intensity image. (b) The phasor ratio image, with the bottom hue representing GFP with autofluorescence, and the upper hue representing the quantum dots.

