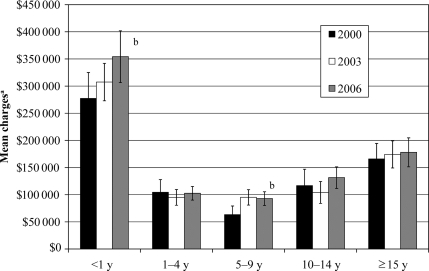
FIGURE 1.
Mean charges according to age category from 2000 to 2006. a Charges corrected to 2009 US$ using the medical consumer price index. b Statistically significant change in mean charges over time, P < .05. Statistically significant differences in mean charges according to each age category, P < .001.

