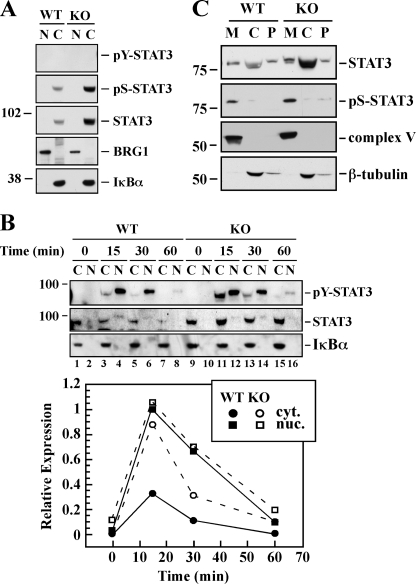
FIGURE 2.
Subcellular distribution of STAT3. The WT and Sirt1-KO MEFs were incubated in the absence (A) or presence (B) of 20 ng/ml murine OSM for 15, 30, and 60 min. Nuclear (N) and cytosolic (C) fractions were prepared and processed for Western blot analysis using antibodies specific for phosphotyrosine (pY), phosphoserine (pS), and unphosphorylated/total forms of STAT3. The membranes were reprobed with antibodies specific for the nuclear marker BRG-1 and the cytoplasmic IκBα. The relative subcellular distribution of Tyr(P)-STAT3 levels in response to OSM treatment was determined by densitometry. Similar results were obtained in a second independent experiment. C, cytosolic (C), mitochondrial (M) and P100 membrane (P) fractions from the WT and Sirt1-KO MEFs were processed for the detection of Ser(P)-STAT3 and STAT3 by Western blot. The membranes were reprobed with the mitochondrial marker complex V and the cytosolic marker β-tubulin. The migration of molecular mass markers (values in kilodaltons) is shown on the left of immunoblots.

