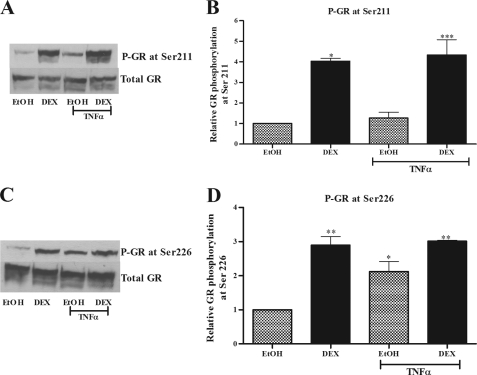
FIGURE 7.
TNFα induces phosphorylation of overexpressed GR at Ser-226 and not Ser-211 in COS-1 cells. COS-1 cells were treated with 1 μm DEX in the absence and presence of 20 ng/ml TNFα for 1 h. The cells were harvested, and whole cell lysates were separated by 8% SDS-PAGE. A and C, phospho-GR-specific antibodies raised against serine 211 (A) and serine 226 (C), respectively, were used for Western blotting. Phospho-GR protein levels were normalized to total GR expressed. Total GR protein levels were measured after membrane was stripped and reprobed with an anti-GR specific antibody. B and D, graphs are representative of pooled results from three independent experiments. The relative amounts of phosphorylation at the specific serine residues were quantified and expressed as amounts of phosphorylated GR relative to total GR with vehicle control (EtOH) set as 1. For statistical analysis, one-way ANOVA with Tukey's multiple comparison post-test was performed. The p values are represented as follows: *, p < 0.05; **, p < 0.01; ***, p < 0.001.

