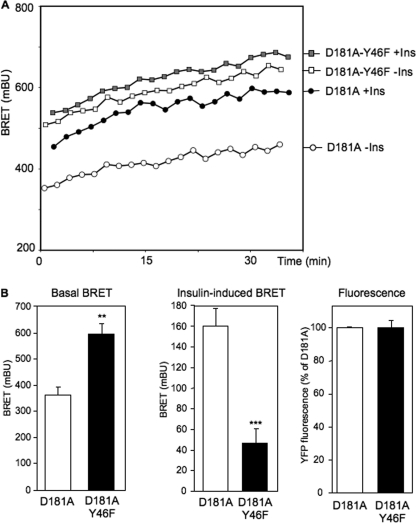
FIGURE 3.
Interaction between the IR and PTP1B mutants in intact living cells. A, HEK-293 cells were transfected with IR-Rluc and either YFP-PTP1B-D181A or YFP-PTP1B-D181A-Y46F expression vectors. BRET measurements were performed in real time after addition of either 100 nm insulin (Ins) or vehicle. Results are representative of five independent experiments. B, basal BRET, insulin-induced (increased above basal at 20 min) BRET, and YFP fluorescence levels in cells expressing YFP-PTP1B-D181A or YFP-PTP1B-D181A-Y46F. Results are the mean ± S.E. of five independent experiments. **, p < 0.01; ***, p < 0.001 when compared with D181A mutant under similar conditions.

