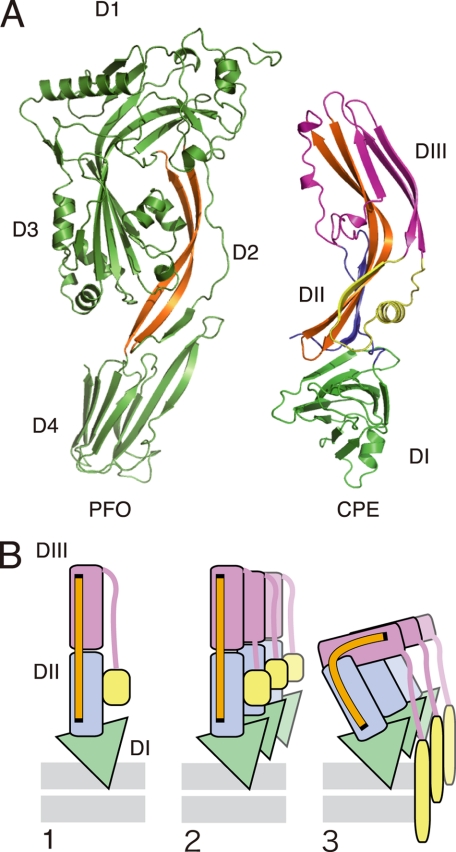
FIGURE 4.
Comparison of structure between CPE and perfringolysin O (PFO, accession code 1PFO) (A) and a putative model showing how the toxin molecules are folded to insert the antipathic strands into the membrane (B). Each domain of CPE is represented by the same colors as shown in Fig. 3A. A, long antiparallel strands shown in orange. B, the diagram based on a model presented previously (39). The long antiparallel strands that function as a hinge module are shown as an orange bar. 1, binding to the membrane surface via domain I (DI). 2, prepore complex shown with three monomers. 3, amphipathic strand inserted upon the buckling of the module composed of domains II and III.

