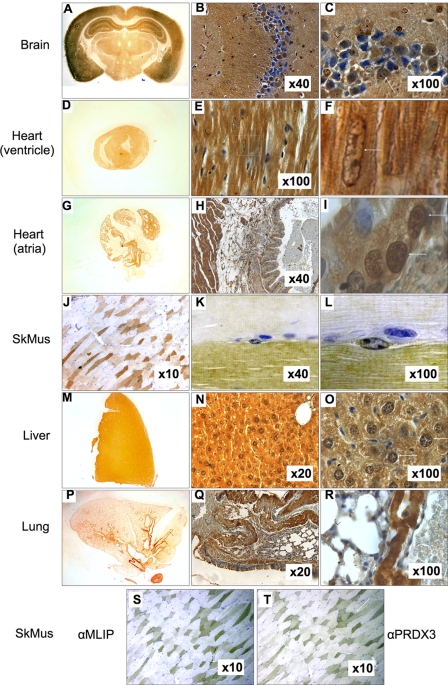
FIGURE 7.
MLIP mouse tissue expression by indirect immunohistochemistry. A–C, brain; D–E, heart ventricles; G–I, atria; J–L, skeletal muscle; M–O, liver; and P–R, lung. F and I, magnified image of heart (E and H, respectively) as indicated by box. Nucleus is identified by arrow. MLIP is expressed primarily in fast oxidative muscle fibers of soleus muscle. MLIP (S) and peroxiredoxin-3 (PRDX3) (T) expression profiles in serial soleus sections. The arrows mark similar fibers in S and T. Magnification is indicated for each image.

