FIGURE 1.
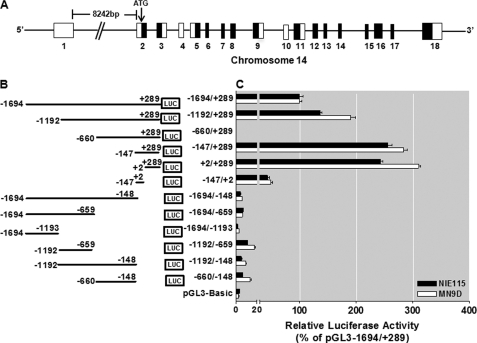
Deletion analysis of PKCδ promoter activity in NIE115 and MN9D cells. A, schematic diagram of mouse PKCδ gene structure on chromosome 14. Exons are marked by boxes and are numbered below each box, and black and white regions within the boxes indicate the coding and noncoding exons, respectively. Arrow indicates the position of the translation start codon (ATG). B, schematic representation of PKCδ promoter deletion/luciferase reporter constructs. An extensive series of PKCδ promoter deletion derivatives was generated by PCR methods and inserted into the pGL3-Basic luciferase vector. The 5′- and 3′-positions of the constructs with respect to the transcription start site are depicted. C, each construct as shown in B was transiently transfected into NIE115 (black bar) and MN9D (white bar) cells. Cells were harvested 24 h after transfection, and luciferase activities were determined. The plasmid pcDNA3.1-βgal was included in each transfection to normalize the promoter activity with transfection efficiency. The activity of full-length promoter construct (pGL3−1694/+289) was arbitrarily set to 100, and the relative luciferase activity of the other constructs was calculated accordingly. The results represent the mean ± S.E. of three independent experiments performed in triplicate.

