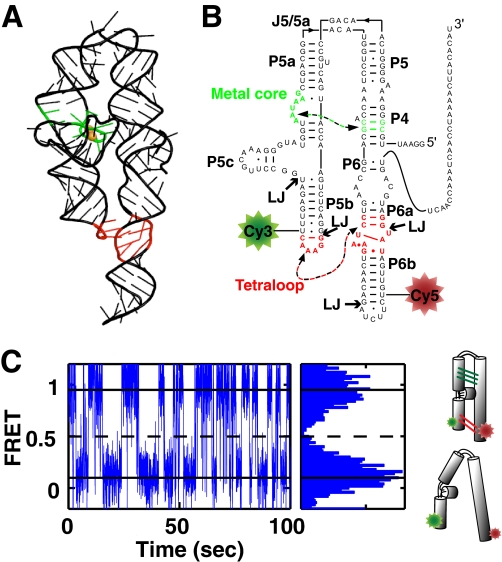
FIGURE 1.
smP4-P6 for smFRET studies. A, rendering of the P4-P6 tertiary structure (PDB code 1GID). The TL/TLR interaction is shown in red, and the MC/MCR is shown in green. B, the secondary structure of smP4-P6 used herein. Ligation junctions are denoted LJ, and the tertiary contacts are colored as in A. C, smFRET trace of smP4-P6 in 2.5 mm Mg2+ (left panel) and cumulative FRET histogram for this trace (right panel). The histogram shows distinct high and low FRET states, as indicated by the solid horizontal lines. The dashed line indicates the position of the FRET threshold. The schematics on the right represent the folded high FRET and unfolded low FRET states.

