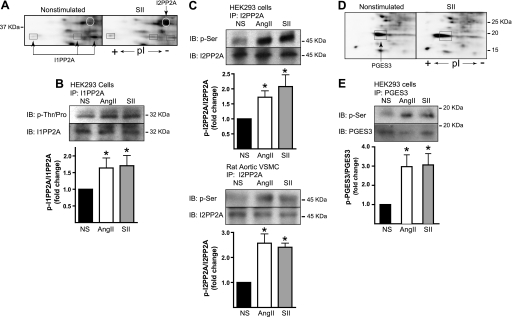
FIGURE 3.
Validation of SII- and AngII-stimulated phosphorylation of I1PP2A, I2PP2A, and PGES3. A, representative Pro Q Diamond-stained two-dimensional gel regions showing SII-induced changes in the appearance of spots identified as I1PP2A and I2PP2A. I2PP2A is present as a single spot that appears upon stimulation, whereas I1PP2A appears as three spots of similar mass but shifting pI consistent with phosphorylation of additional sites. B, phospho-amino acid-specific immunoblot (IB) of immunoprecipitated (IP) I1PP2A. C, phospho-amino acid-specific immunoblots of endogenous I2PP2A immunoprecipitated from HEK293 cells (upper panel) and vascular smooth muscle cells (lower panel). In B and C, serum-deprived HEK-AT1AR or primary rat aortic vascular smooth muscle cells (VSMC) were stimulated for 5 min with SII or AngII before lysis and immunoprecipitation as described. Representative immunoblots are depicted above bar graphs indicating the fold change in phosphorylation relative to vehicle treated cells (NS). The intensity of the phospho-specific immunoblot was normalized to the total amount of I1PP2A or I2PP2A in each immunoprecipitate. *, t test p < 0.05, greater than NS (n = 5 for I1PP2A, n = 3–6 for I2PP2A). Pro Q Diamond-stained two-dimensional gel regions showing the SII-induced change in the appearance of the spot identified as PGES3. PGES3 appears as a single phosphoprotein that undergoes an acidic pI shift consistent with phosphorylation of additional sites. E, phospho-Ser-specific immunoblot of immunoprecipitated PGES3. HEK-AT1AR cells were stimulated for 5 min with SII or AngII before lysis and immunoprecipitation. Representative immunoblots are depicted above bar graphs indicating the fold change in phosphorylation relative to NS cells. The intensity of the phospho-specific immunoblot was normalized to the total amount of PGES3 in each immunoprecipitate. *, t test p < 0.05, greater than NS (n = 5).

