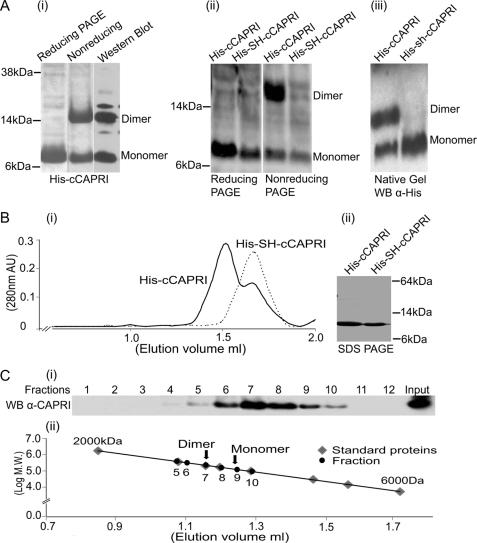
FIGURE 2.
Dimerization of the helix motif in the C-terminal tail of CAPRI. A, panel i, SDS-PAGE of purified His-cCAPRI. His-cCAPRI samples were subjected either to reducing conditions (the protein was treated with loading buffer containing DTT before heating to 94 °C for 5 min and running on SDS-PAGE) or to nonreducing conditions (DTT-free loading buffer). Gels were Coomassie-stained. Nonreducing gels were also Western-blotted using anti-His tag antibody. Panel ii, dimerization of His-cCAPRI was abolished by mutation of leucines at position 775 and 778 to Ser and His. Total lysates of bacteria transformed with His-tagged constructs of both wild type (His-cCAPRI) and mutant CAPRI (His-SH-cCAPRI) were run on reducing or nonreducing SDS-PAGE. Western blotting was performed with anti-His tag antibody. The blots shown are representative of at least three independent experiments. Panel iii, bacterially derived purified His-cCAPRI and His-SH-cCAPRI were analyzed by native PAGE followed by Western blotting with anti-His tag antibody. The blots shown are representative of three independent experiments. B, gel filtration analysis of dimerization of His-cCAPRI. Panel i, aliquots of purified His-cCAPRI or His-SH-cCAPRI were loaded onto a Superose 12 column. Samples were eluted at a flow rate 0.1 ml/min, and fractions were collected and submitted to SDS-PAGE and Western blotting with anti-His tag antibody. The UV absorption at 280 nm is shown and shows that purified His-cCAPRI eluted as two peaks whereas His-SH-cCAPRI eluted as single peak. Panel ii, Coomassie-stained SDS-PAGE showing the purity of His-cCAPRI and His-SH-cCAPRI proteins used for gel filtration analysis. C, gel filtration analysis of full-length CAPRI dimerization. Purified full-length EE-CAPRI was loaded onto Superose 12 column, and samples were eluted at a flow of 0.1 ml/min with UV absorption at 280 nm being measured. Fractions were analyzed by SDS-PAGE followed by Western blotting with anti-CAPRI antibodies. Panel i, Western blot of the fractions. Panel ii, plot showing the molecular masses of the proteins from the column fractions (black) and those of the standard proteins (gray) from the calibration curve. Arrows indicate the positions of the dimeric and monomeric forms of EE-CAPRI within the standard curve.

