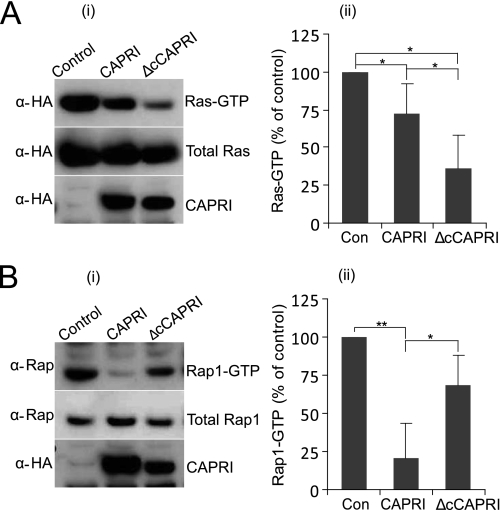
FIGURE 6.
Wild-type and monomeric CAPRI display different RasGAP and Rap1GAP activities. A, RasGAP assays (n = 5). CHO cells were cotransfected with myc-H-Ras and either HA-CAPRI or HA-ΔcCAPRI, and RasGAP assays were performed with GST-RBD pulldown as detailed under “Experimental Procedures” with anti-Myc and anti-HA antibodies to detect Ras and CAPRI, respectively. B, Rap1GAP assays (n = 4). CHO cells were transfected with empty vector DNA as control (Con), full-length HA-CAPRI, or HA-ΔcCAPRI, and RapGAP assays were performed as detailed under “Experimental Procedures” using GST-RalGDS to pull down Rap1-GTP. Anti-HA and anti-Rap1 antibodies were used to detect CAPRI and Rap1, respectively. Panel i show Western blots from one representative experiment; panel ii shows mean ± S.E. of five (A) and four (B) independent experiments. Quantification of Ras-GTP and Ras-GTP levels is expressed as percentage of levels in control cells. Statistics are analysis of variance. *, p ≤ 0.05; **, p ≤ 0.001.

