FIGURE 6:
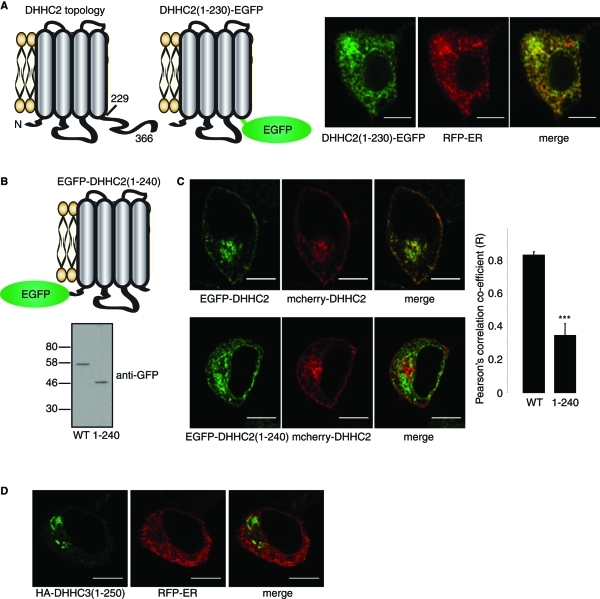
The C-terminus of DHHC2 regulates intracellular targeting. (A) Schematic of DHHC2 membrane topology, and representation of the topology of a DHHC2(1–230)-EGFP construct. Numbers represent amino acid positions. The images show PC12 cells cotransfected with DHHC2(1–230)-EGFP and RFP-ER. (B) Schematic of the membrane topology of an EGFP-DHHC2(1–240) construct (Top). EGFP-DHHC2 and EGFP-DHHC2(1–240) were transfected into HEK293 cells. Lysates prepared from transfected cells were resolved by SDS–PAGE and analyzed by immunoblotting with a monoclonal GFP antibody (Bottom). Position of molecular weight markers (kDa) are indicated on the left. (C) EGFP-DHHC2 (Left, Top) or EGFP-DHHC2(1–240) (Left, Bottom) were cotransfected into PC12 cells with mCherry-DHHC2. Pearson's r values showing covariance of the fluorescence intensity of GFP-tagged constructs relative to mCherry-DHHC2 were calculated using Image J software and results show mean values ± SEM (n = 5 cells for each construct). The data were analyzed using a Student's t test, which revealed a significant difference between DHHC2 and DHHC2(1–240) (*** denotes p < 0.001). (D) Confocal images showing the localizations of HA-DHHC3(1–250) stained with HA antibody and a mouse secondary antibody conjugated to Alexa Fluor 488, and RFP-ER. Scale bars on all images represent 5 μm.

