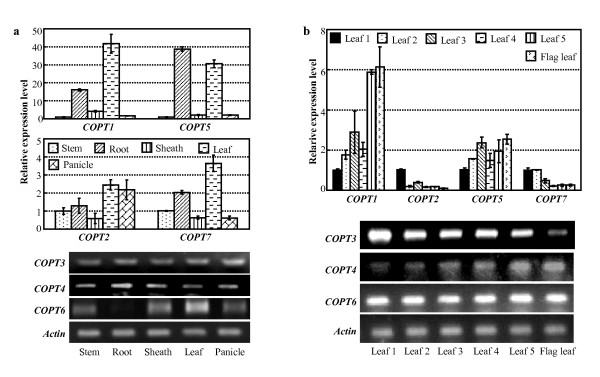
Figure 7.
The tissue-specific and spatiotemporal expression patterns of rice COPT genes by qRT-PCR and RT-PCR. Bar represents mean (3 replicates) ± standard deviation. (a) Expression of COPTs in different rice tissues. (b) Expression of COPTs in different aged rice leaves in booting-stage plants, which produced six leaves in the main shoot. Leaf 1 was the oldest leaf and flag leaf was the youngest leaf in the plants.

