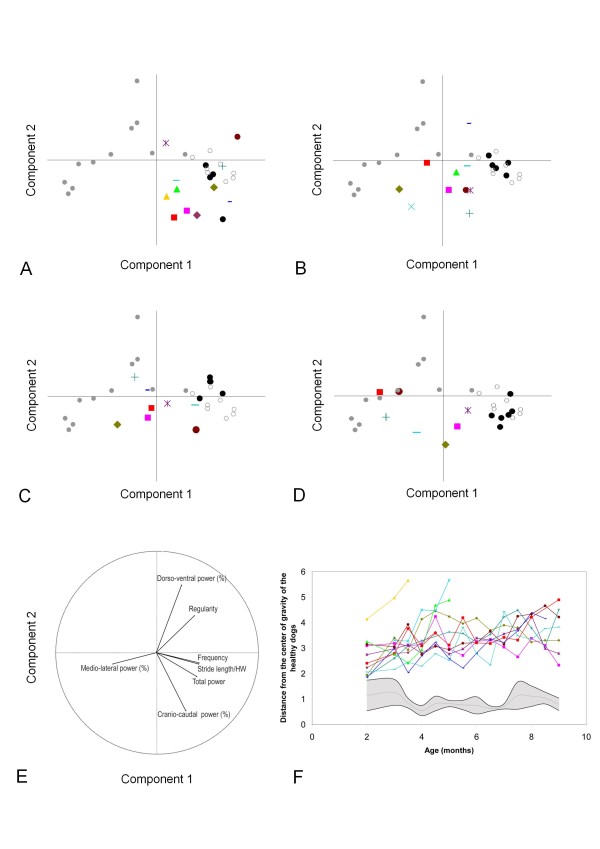
Figure 2.
Using principal component analysis (PCA) for the follow-up of individuals . The active individuals, used to define the plane, were eight healthy adult dogs represented by empty circles, and eleven GRMD adult dogs represented by grey points. 94.53% of the total variance is explained by the two first components, component 1 along the X axis and component 2 along the Y axis. The projection of the individuals on the PCA plane following these components are represented in panels A to D, and the projection of the variables in panel E. The healthy and GRMD dogs of the present study were used as supplementary individuals. Each GRMD dog is represented using his own symbol (see table 1). The healthy growing dogs are represented by black points. A: projection of the 2 months-old dogs on the PCA plane; B: projection of the 4 months-old dogs on the PCA plane; C: projection of the 6 months-old dogs on the PCA plane; D: projection of the 9 months-old dogs on the PCA plane. E: projection of the seven variables. The first component explains 72.61% of the total variance and is mainly explained by the stride frequency, the stride length, the total power and the medio-lateral part of the power. The second component explains 21.92% of the total variance and is mainly explained by the cranio-caudal and the dorso-ventral part of the power. F Evolution of the distance of each GRMD dog from the centre of gravity of the six age-matched healthy controls. The grey zone represents the mean (grey line) ± 1SD (black lines) of this distance in healthy dogs.

