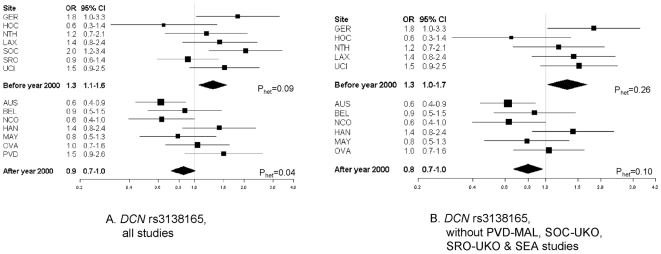
Figure 2. Sensitivity analysis for DCN rs3138165 and serous epithelial ovarian cancer stratified by case recruitment period.
Associations represent ORs (95% CI) for individual study (squares) and study-adjusted pooled (diamonds) estimates. Models are ordinal genetic risk models. HAN-HJO and HAN-HMO were combined for presentation. Phet refers to P value for heterogeneity in odds ratios among studies.

