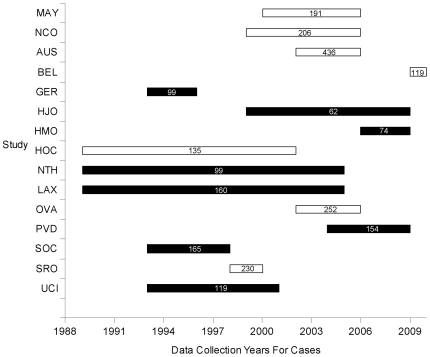
Figure 3. Recruitment years for cases in each study.
White bars denote studies showing no association or inverse associations between DCN or LUM SNPs with serous epithelial ovarian cancer, whereas black bars denote studies showing positive associations. Numbers in bars represent number of cases used in analyses.

