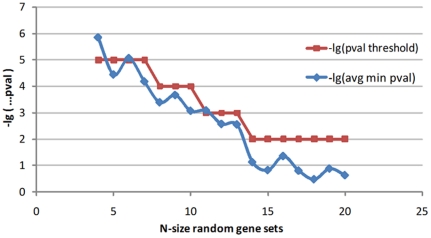
Figure 2. Statistical significance thresholds of CRMs.
A procedure randomly picks a gene-set with N genes from the background and search for common CRMs (δ = 0.7) in that gene-set. The statistical significant p-value for each CRM is estimated and the minimum one is reported. Each point in the blue curve is a transformed value of the mean of the minimum p-values of CRMs in 100 times running the procedure for the corresponding k. Approximately, the red curve shows which thresholds should be used for the non-random cases. After N = 14 genes, only one threshold is used to ensure the significance (p-value = 0.01).

