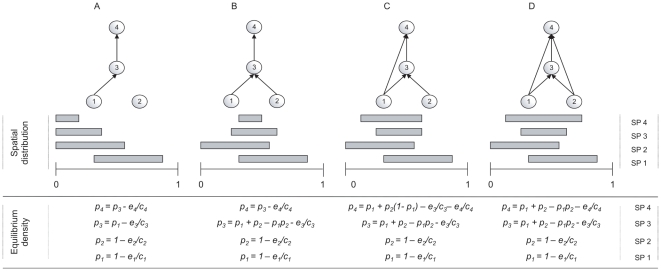
Figure 1. Calculation of available patches for simple food webs.
The webs are ordered from left to right by their connectance. The grey bars illustrate the spatial co-distribution of species. The length of the bars depicts the equilibrium spatial occupancy and the superposition with other species in the co-distribution.

