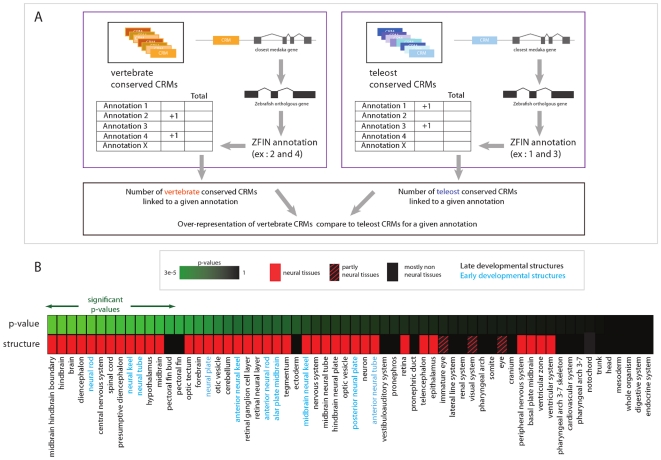
Figure 2. Analysis of the genomic location of CRMs.
A. Schema of the procedure. For each predicted CRM, the closest medaka gene is identified. Next we transferred zebrafish in-situ annotation to the medaka orthologous gene. We calculated the significance of the overrepresentation of CRMs showing annotations for specific tissues from the vertebrate conserved dataset compared to a background set (composed of the whole set of predicted CRMs). B. Enrichment of vertebrate conserved CRMs around genes expressed in neuronal tissues. Red squares correspond to neuronal structures. P-values are shown with a color code, the most significant enrichments correspond to the p-values in green, the least significant to p-values in black. Significant p-value cutoff has been determined for a 5% false discovery rate (Benjamini, Hochberg method, see Supplementary Table S4 for numerical values).

