
Figure 1. Rim1 modulates inactivation properties of Cav2.2/β3 calcium channels.
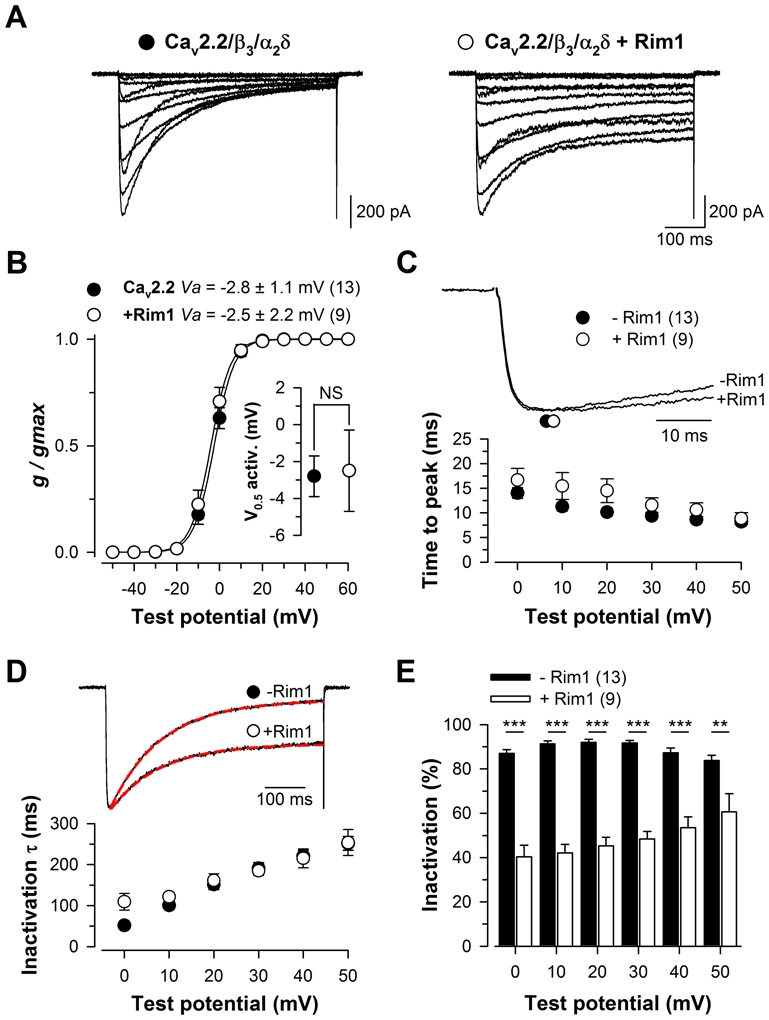
A, Representative set of whole cell Ba2+ current traces recorded from a Cav2.2/β3/α2δ1b (left panel) and Cav2.2/β3/α2δ1b/Rim1-expressing cell (right panel) in response to 500 ms depolarizing steps to values ranging between −40 mV and +60 mV from a holding potential of −80 mV. B, Corresponding mean normalized values of the voltage-dependence of Ba2+ conductance in the two populations. Inset presents the mean half-maximal activation potential for Cav2.2/β3/α2δ1b (filled circles) and Cav2.2/β3/α2δ1b/Rim1 channels (open circles). C, Representative normalized Ba2+ current traces recorded at +20 mV for Cav2.2/β3/α2δ1b and Cav2.2/β3/α2δ1b/Rim1 channels showing activation kinetics (top panel). Symbols illustrate the time to peak of the current. Mean values for the time to peak of the Ba2+ current as a function of membrane potential for Cav2.2/β3/α2δ1b (filled circles) and Cav2.2/β3/α2δ1b/Rim1 (open circles) channels (bottom panel). D, Representative normalized Ba2+ current traces recorded at +20 mV for Cav2.2/β3/α2δ1b and Cav2.2/β3/α2δ1b/Rim1 channels showing differences in inactivation kinetics (top panel). The superimposed red dashed lines correspond to the result from fitting a single exponential function to the inactivating phase of the current. Mean values for the time constant τ of Ba2+ current inactivation for both conditions as a function of membrane potential (bottom panel). E, Corresponding mean values for the extent of current inactivation for Cav2.2/β3/α2δ1b (filled bars) and Cav2.2/β3/α2δ1b/Rim1 channels (open bars). Values were significantly decreased in the presence of Rim1 at all potential values studied.