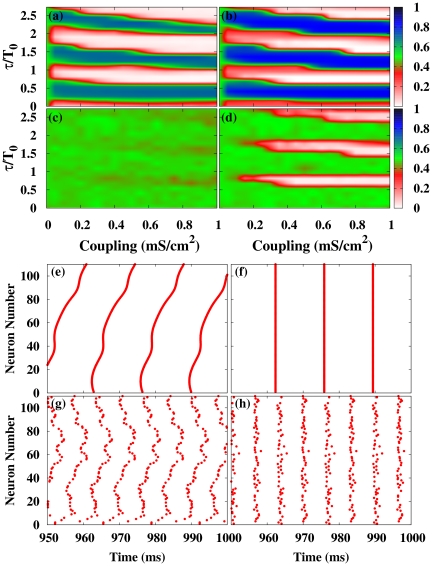
Figure 2. Local and global synchronization regions and rater plots for different networks.
(a-d) Contour plots of  [
[ ] for the HH neuron model in the coupling strength-delay time phase space corresponding to (a) [(c)] a SWN (
 ) and (b) [(d)] a RN. In panels (e-h) we show raster plots of a fraction of the neurons for different networks and delays:
  [
[ ] in (e) [(g)] for a SWN (
 ) and (f) [(h)] for a RN. The coupling strength is
  mS cm
mS cm .
.

