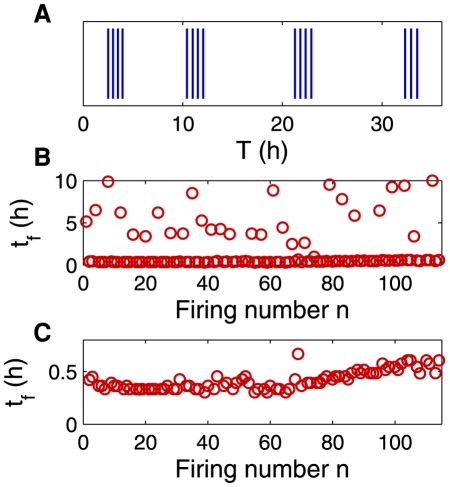
Figure 4. “Bursting” behavior in trap D (Utricularia australis).
A: excerpt of the firing events. A vertical bar is drawn each time a firing occurs (time is set to 0 at the beginning of the sample). Firings occur by bursts of 3 or 4 events. B: time intervals  between successive firings for all the recorded firings. The scattered points correspond to the times between consecutive bursts, while the regular line at the bottom is drawn the very regular firings inside a burst. C: Magnification of the bottom line of panel B. The associated randomness index is
  .
.

