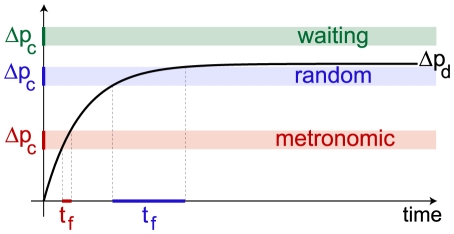
Figure 10. Model explaining the trap behaviors.
The black curve is the evolution of the pressure difference  due to the deflation process, saturating at a value
  . Firing of the trap door occurs at a time
  when
when  reaches the buckling pressure
  . Fluctuations in
  entail fluctuations in
  which are bigger when
  is close to
  , explaining the scattered values of
  for “random” traps. If
  is bigger than
  , buckling is impossible and the trap is in a “waiting” state.

