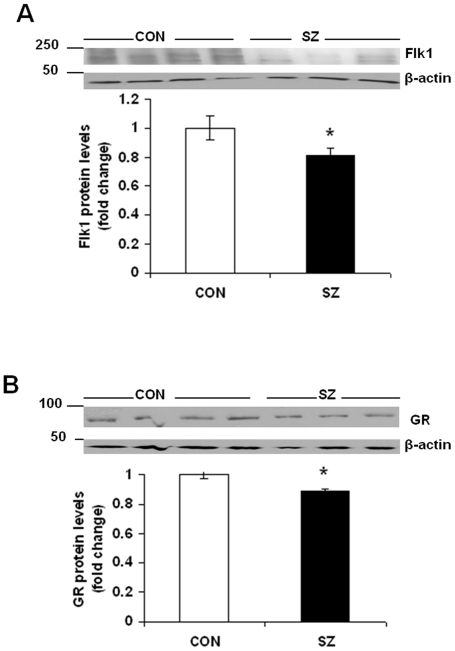
Figure 7. Reduced Flk1 and GR protein levels in prefrontal cortex of schizophrenia subjects.
(A) Reduced Flk1 protein levels in prefrontal cortex samples from schizophrenia subjects. Flk1 protein levels in the prefrontal cortex of schizophrenia (SZ; n = 10) and control (CON; n = 8) subjects were determined by western blot analysis. Data represent mean±SE expressed as fold change in Flk1 protein levels as compared to CON. *P<0.05 versus CON (t test). (B) Reduced GR protein levels in prefrontal cortex samples from schizophrenia subjects (SZ; n = 10) as compared to control subjects (CON; n = 8). Data represent mean±SE expressed as fold change in GR protein levels as compared to CON. *P<0.05 versus CON (t test).

