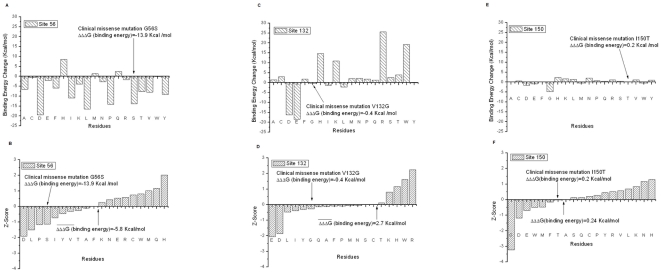
Figure 3. The results of structure-based energy calculations on the dimer affinity (binding free energy) with three different force field parameters (Charmm27, Amber98 and Oplsaa) and then results averaged for the clinically observed missense mutations G56S, V132G, and I150T, we used four force fields, which are Charmm27, Charmm19, Amber98 and Oplsaa, then results averaged).
The left panels are the predicted energy changes of the binding free energy and the right panels are the Z-Scores of binding energy change. The  in the graph is the mean of binding free energy change over the 19 mutations. The results are shown for G56 (a–b), V312 (c–d) and I150 (e–f) sites.

