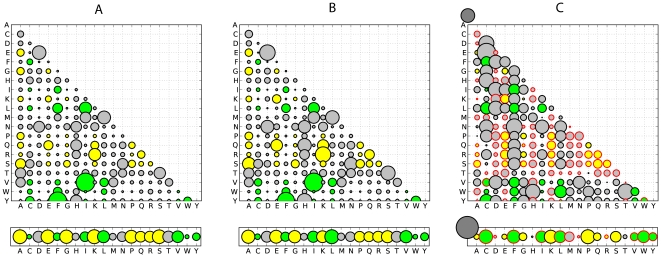
Figure 2. Amino acid exchangeability matrices and amino acid frequencies for ordered and disordered regions derived from the SwissProt data set: here, the area of each bubble represents the rate of a substitution or the amino acid frequency.
(A) Model estimates for IDRs. (B) Model estimates for ordered regions.
(C) Relative difference ( ) between
the corresponding values for disordered and ordered models (plots A and
B).
  and
and  stand for
the relative evolutionary rates in ordered and disordered regions,
respectively. Order promoting amino acids are green, disorder promoting
ones yellow. Exchangeabilities between order and disorder promoting
residues are gray. Bubbles with red border correspond to negative
values, i.e. have a lower frequency in IDRs.

