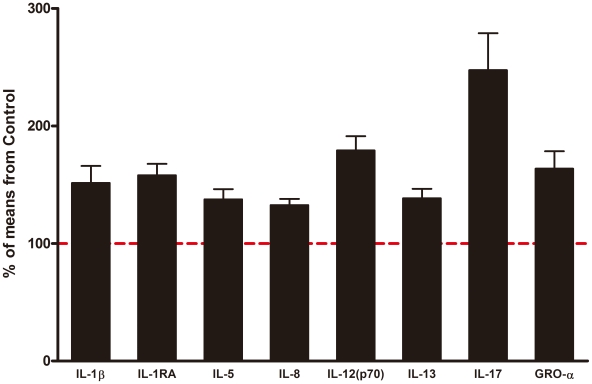
Figure 1. Fold changes of analytes measured by multiplex assay kits in subjects with autism spectrum disorder.
The results represent the % concentration relative to the mean concentration of each analyte in the control group (dashed line in red). Data are expressed as the mean plus standard error of the mean.

