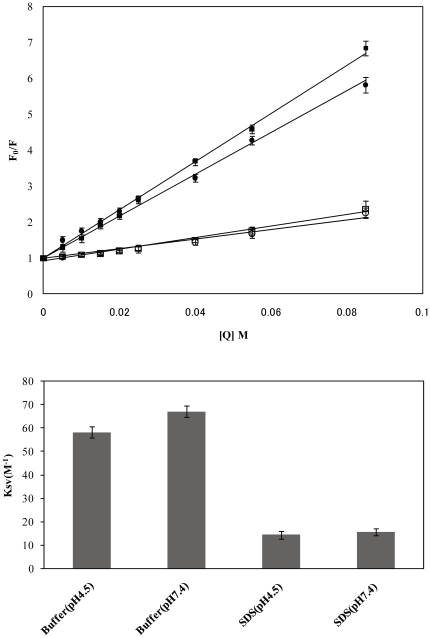
Figure 2. Insertion of LC4 into SDS micelles monitored by acrylamide quenching of LC4 fluorescence.
(A) Stern–Volmer plot. (•), in phosphate buffer at pH 4.5; (▪), in phosphate buffer at pH 7.4; (○), in SDS micelles at pH 4.5; (□), in SDS micelles at pH 7.4. Peptide-coupled SDS micelles were preincubated for 15 min before measurements. [Q] is the quencher concentration (5–85 mM). The SDS micelles concentration was 10 mM, and the peptide concentration was 50 µM. (B) Stern–Volmer constants calculated from the acrylamide quenching experiments in (A). Each error bar shows the SEM from six measurements.

