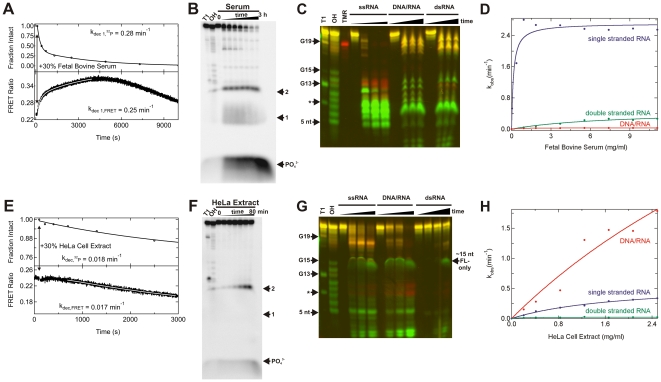
Figure 2. Monitoring the degradation of ssRNAs and dsRNAs in fetal bovine serum and HeLa S100 cytosolic cell extract.
(A) Degradation time course of the 21-nt dsRNA in 30% (v/v) serum, as monitored either in real-time by steady-state FRET (bottom) or discontinuously by radioactive labeling and denaturing gel electrophoretic analysis of time points (top). Solid lines represent double-exponential fits to both types of degradation data. In both cases the faster of the two rate constants are reported here and elsewhere and demonstrate good agreement between the FRET and radioactive assays. (B) Denaturing radioactive gel electrophoretic analysis corresponding to the data in panel A (top). RNase T1 (“T1”) and alkali (“OH”) ladders were run alongside varying time points of RNA degradation to identify the products. Arrows denote bands corresponding to positions 1, 2 (from the 5′ end), and PO4 3−. (C) Denaturing FRET gel revealing the serum degradation patterns of the indicated RNAs as a function of time, alongside RNase T1 (“T1”, leading to cleavage 3′ of G as indicated by arrows) and alkali (“OH”) ladders as well as a TMR-only labeled color calibration standard. The * denotes a double cut at both G13 and G3. (D) Observed degradation rate constants for the various RNAs as a function of total serum protein concentration, quantified from FRET time traces as exemplified in panel A (bottom). (E) Degradation time course of the 21-nt dsRNA in 30% (v/v) cell extract, as monitored either in real-time by steady-state FRET (bottom) or discontinuously by radioactive labeling and denaturing gel electrophoretic analysis of time points (top). Solid lines represent single-exponential fits to both types of degradation data with the respective rate constants shown, demonstrating good agreement between the FRET and radioactive assays. (F) Denaturing radioactive gel electrophoretic analysis corresponding to the data in panel E (top). RNase T1 (“T1”) and alkali (“OH”) ladders were run alongside varying time points of RNA degradation to identify the products. Arrows denote bands corresponding to positions 1, 2 (from the 5′ end), and PO4 3−. (G) Denaturing FRET gel revealing the cell extract degradation patterns of the indicated RNAs as a function of time, alongside RNase T1 (“T1”, leading to cleavage 3′ of G as indicated by arrows) and alkali (“OH”) ladders. The * denotes a double cut at both G13 and G3. (H) Observed degradation rate constants for the various RNAs as a function of total cell extract protein concentration, quantified from FRET time traces as exemplified in panel E (bottom). Further details of the experiments are found in Materials and Methods.

