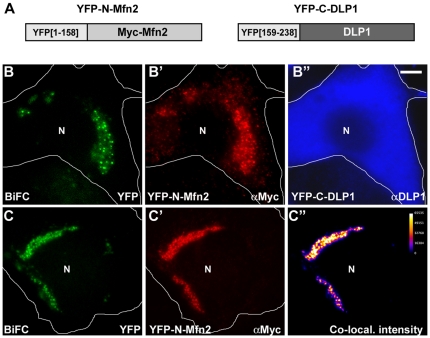
Figure 7. BiFC demonstrating the Mfn2/DLP1 interaction in cells.
(A) Constructs used for the BiFC detection of the Mfn2/DLP1 interaction. The YFP N-terminal fragment (YFP[1–158]) was fused to Myc-Mfn2 (YFP-N-Mfn2), and the YFP C-terminal fragment (YFP[159–238]) to HA-DLP1 (YFP-C-DLP1). (B–C”) BHK-21 cells were co-transfected with YFP-N-Myc-Mfn2 and YFP-C-HA-DLP1 and immunostained for Myc (B', C') and DLP1 (B”). Mitochondrial clusters of co-transfected cells show bright punctate YFP signal (B, C). White lines demarcate the cell boundary. The ImageJ Intensity Correlation Analysis was used for assessing co-localization (C”). N: nucleus. Scale bars: 10 µm.

