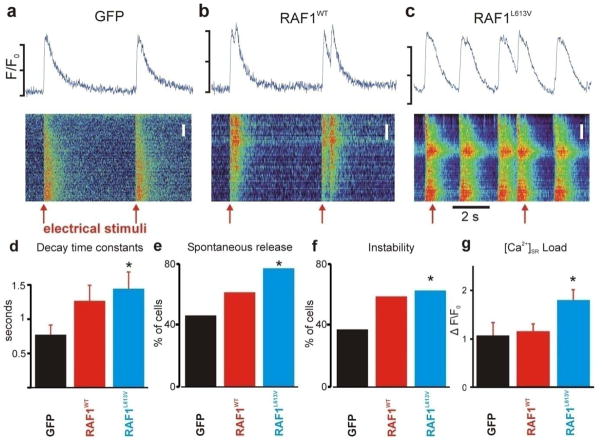
Figure 8. Intracellular calcium handling is dysregulated in neonatal rat cardiomyocytes expressing wild-type and L613V RAF1.
(a-c) Intracellular Ca2+ transients from the three groups, as indicated, expressed as space-time images (bottom) and average intracellular fluorescence (units of F/F0, top). Image scaling and Ca2+ transient scale bars are different in the three cases because of different baseline Ca2+ transient amplitudes. Top scale bars indicate F/F0 ranges of 1.0–1.5 (left), 1.0–2.0 (middle), and 1.0–2.0 (right). Red arrows indicate timing of electrical stimuli, here delivered every 5 seconds. Spatial scale bars indicate 2 μm in all cases. (d) Ca2+ transient decay time constants, calculated from the following numbers of cells: n=42 (GFP), n=39 (WT RAF1) and n=36 (L613V RAF1). *P<0.05 vs. GFP by two-tailed Student’s t-test. (e) Percentage of cells in each group exhibiting spontaneous Ca2+ release when paced at 0.2 Hz. *P<0.05 vs. GFP by two-tailed Fisher’s exact test. (f) Percentage of cells in each group showing unstable beat-to-beat Ca2+ release when paced at 2 Hz. *P<0.05 vs. GFP by two-tailed Fisher’s exact test. (g) SR Ca2+ load, quantified as peak ΔF/F0 in response to 20 mM caffeine. Bars calculated from n=30 cells from each group. *P<0.05 vs. GFP by two-tailed Student’s t-test. See Supplementary Methods for details of calculation of these metrics.

