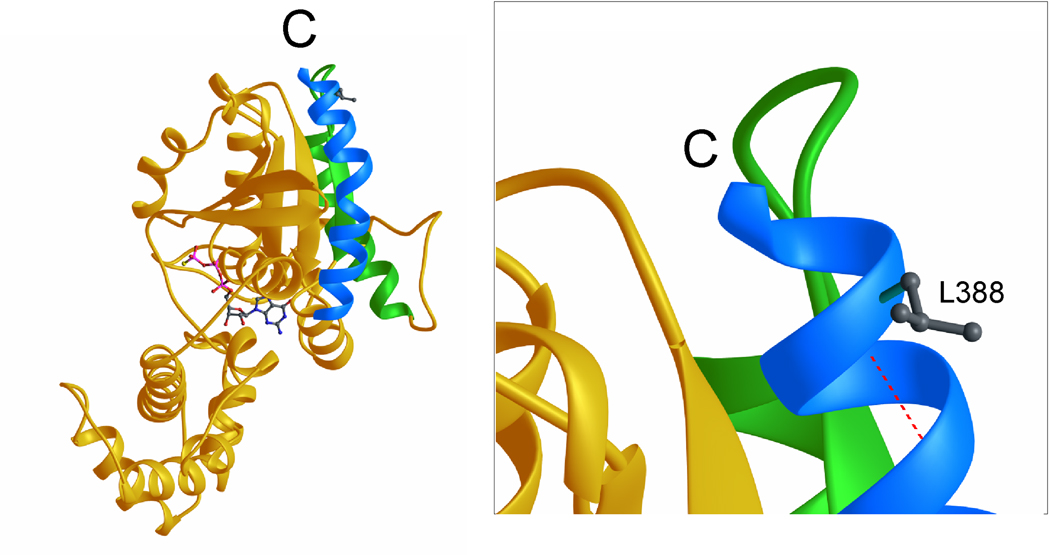
Figure 3.
Ribbon representation of Gsα in complex with GTP-γs. Left: The C-terminal helix (α5) is colored in light blue, the helix α4 and the β-strand β6 in green and the GTP-γs molecule is depicted as a ball and stick representation. C denotes the C-terminus. Right: Close-up of the C-terminal region. The side chain of L388 is depicted and the hydrogen bond between the amide group of L388 and the carbonyl group of Q384 is shown in red (dashed line).

