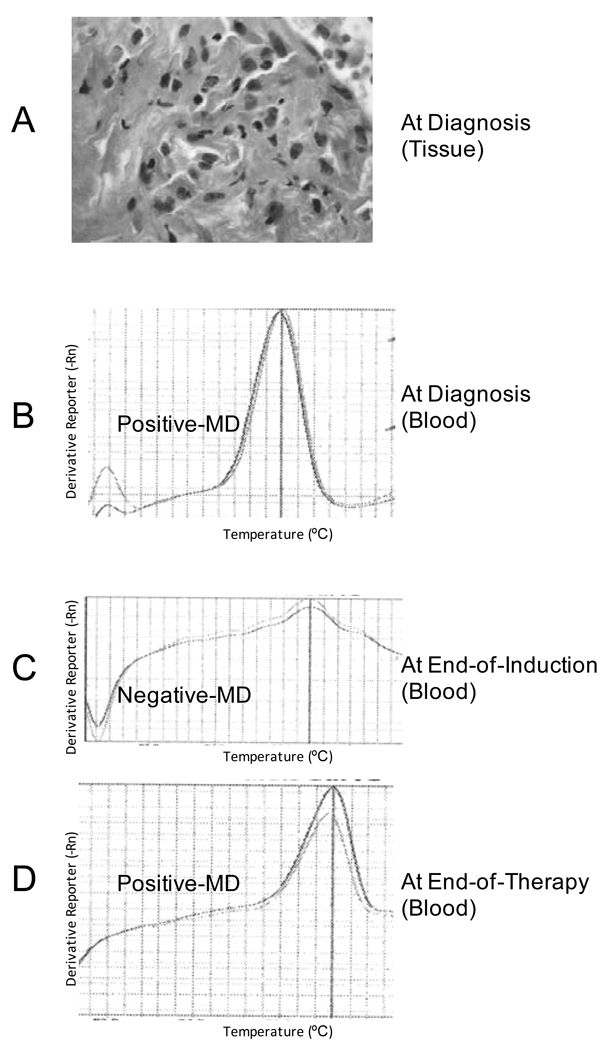
Figure 2.
Histology and Minimal Disease (MD) Melt Curves and Associated Amplified Products from a patient with Stage III/ Diffuse Large B-cell Lymphoma (DLBCL). Panel A: Haematoxylin and eosin stain of DLBCL tissue at diagnosis. Original magnification ×400; Panel B: Amplified product and positive-melt curve from diagnostic blood; Panel C: Negative-melt curve of from blood specimen at end of induction (EOI); Panel D: Positive melt curve of amplified product from blood specimen at end of therapy (EOT).

