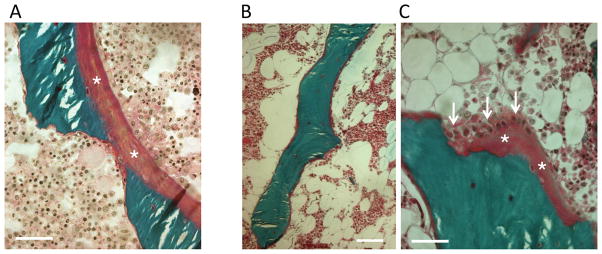
Figure 6.
. Patients have abnormal osteoid formation. Light microscopic analysis of transiliac bone sections. Goldner’s trichrome staining represents mineralized bone matrix in green and osteoid in purple. (A) Patient 1 has thick osteoid seams in purple (asterix) on the mineralized bone surface (bar represents 50 μm). (B) Patient 2 has generally thin osteoid, covering the mineralized (green) trabecular surface (bar represents 100 μm). (C) Patient 2: a focal area at higher magnification showing a thicker osteoid (asterix) with active osteoblasts (arrows) (bar represents 50 μm).

