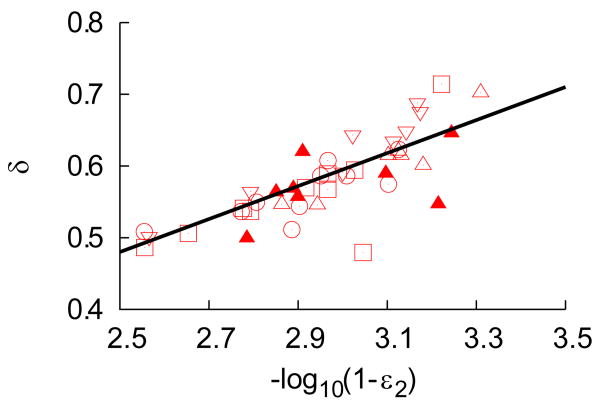
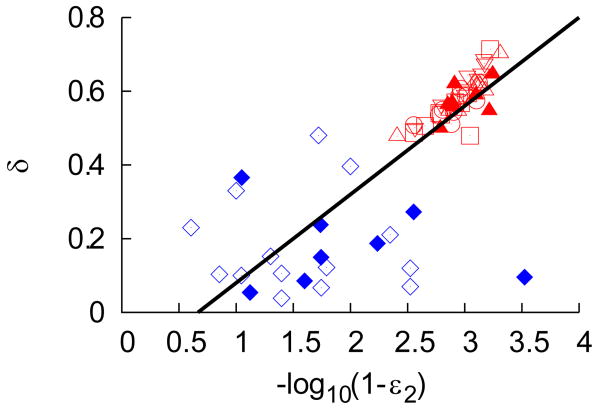
Figure 2. The loss rate of infected cells increases with drug effectivenees.
(a). Distribution of the loss rate of infected cells, δ, as a function of the final (log-transformed) effectiveness ε2 in patients dosed with telaprevir. Squares are telaprevir monotherapy 450 mg q8h, upper triangles are 750 mg q8h tablets (filled triangles when used in combination with peg-IFN), reverse triangles are 750 mg q8h suspension and circles are 1250 mg q12h suspension. The black line is the best-fit regression line (r=0.79, p-value<0.001).
(b). Distribution of the loss rate of infected cells, δ, as a function of the final (log-transformed) effectiveness ε2 in patients dosed with telaprevir (red symbols) compared to values found in the literature for genotype 1 Caucasian patients treated with 10 MIU of IFN daily (2-3, 18) monotherapy (blue diamond) or in combination with ribavirin (blue filled diamond). The black line is the best-fit regression line (r=0.78, p-value<0.001) where one point, considered as an outlier, has not been taken into account.


