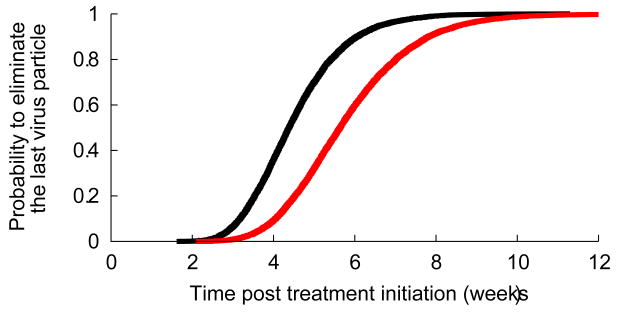
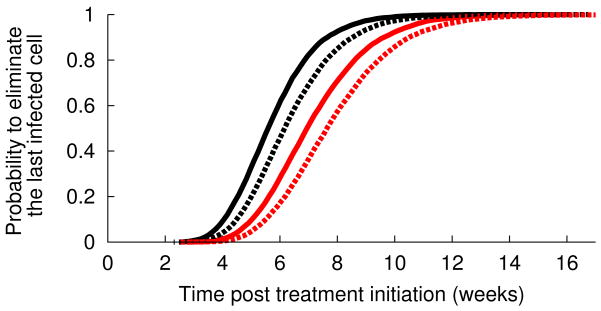
Figure 3.
Estimated cumulative probability distribution function (cdf) for the treatment duration needed to eliminate the last remaining (a) virus particle and (b) infected cell. The black line corresponds to perfect treatment adherence whereas the red line represents the case of partial adherence where of three doses per day one dose is randomly missed every two days (Methods). Because the cdf for the time to eliminate the last infected cell depends on the unknown value for the viral production rate in absence of treatment (p in Eq. 1), the solid lines in (b) correspond to p=100 virions/day and the dashed lines correspond to p=10 virions/day.


