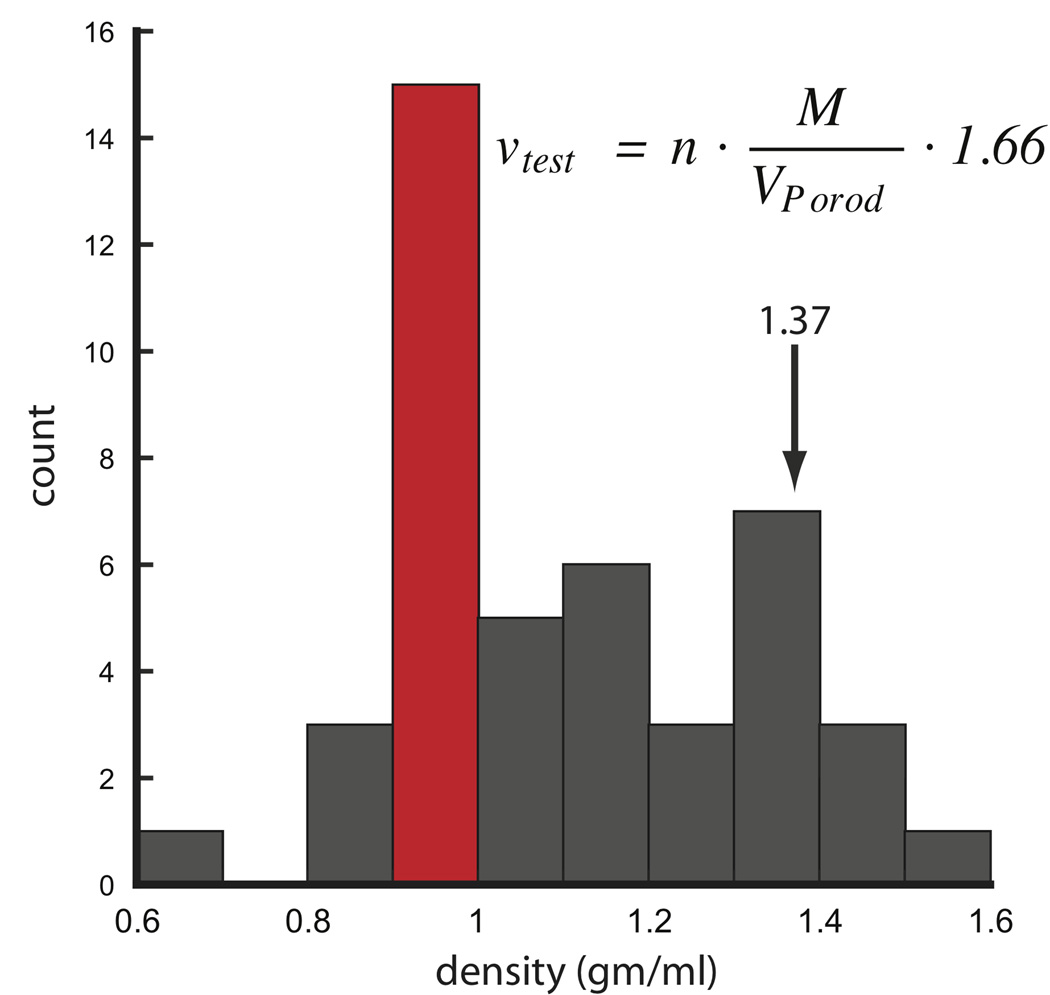
FIGURE 8.
Histogram analysis of protein densities calculated from SAXS data using 31 different proteins and conditions. For each protein, V was calculated using PRIMUS limiting the data to the Porod-Debye region. Distribution shows the most likely density is 0.9 to 1.0 gm·cm−3. The equation can be used to calculate a test density where n is the number of subunits in multimeric complexes. For hetero-complexes, n is 1. Units of M, VPorod and 1.66 are in Da, Å3 and Å3·gm·cm−3·Da−1, respectively. SAXS data was taken from http://www.bioisis.net.

