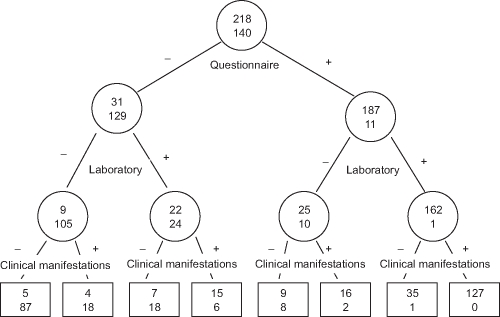
Figure 2.
Schematic representation of the classification tree for the cryoglobulinaemic vasculitis (CV). Within each circle and box is the number of the patients with CV according to the ‘gold standard’ (upper value) and the number of controls without CV according to the gold standard (lower value). Interior nodes are denoted by circles and terminal nodes by boxes. The criterion used in each node of the tree to discriminate between cases and controls is reported beneath the circles. Details of the three-item criterion set, questionnaire, clinical and laboratory, are given in Figure 1; they were assessed by the binary recursive partitioning method. Only those subjects for whom the entire three-item criterion set was available were included in this procedure (358 subjects: 218 patients with CV and 140 controls). The sequential approach selected the questionnaire item as the first node of the tree, which divided the 358 observations into groups of 160 and 198 individuals, with a probability of CV of 19.4% (less than two out of the three questions) and 94.4% (at least two out of the three questions), respectively. The latter group, with greater probability of CV, was then partitioned into groups of 35 and 163 individuals, depending on whether the item ‘at least two out of the three laboratory features’ was satisfied. The respective probabilities of CV for these groups were 71.4% and 99.4%, respectively. Both these groups were further subdivided by the item ‘at least three out of the four clinical features’, and the latter one, with greater probability of CV (99.4%) was partitioned into groups of 36 and 127 individuals with probability of CV of 97.2% and 100%, respectively. Then, the final probability of CV provided by the tree-based model (‘at least two out of the three questions’ → ‘at least two out of the three laboratory features’ → ‘at least three out of the four clinical features’) was 100%, based on 127 individuals. Similarly, the final probability of lacking a CV, beginning from the first node of the tree, was 80.6% (less than two out of the three questions) and 5.6% (at least two out of the three questions), respectively. The former group, with greater probability of lacking a CV, was then partitioned into groups of 114 and 46 individuals depending on whether the item ‘at least two out of the three laboratory features’ was or was not satisfied. The probabilities of lacking a CV for these groups were 92.1% (less than two out of the three laboratory features) and 52.2% (at least two out of the three laboratory features). Both these groups were further subdivided by the item ‘at least three out of the four clinical features’, and the former one, with greater probability of lacking a CV (92.1%) was partitioned into groups of 92 (less than three out of the four clinical features) and 22 (at least three out of the four clinical features) individuals with probability of lacking a CV of 94.6% and 81.8%, respectively. Then, the final probability of lacking CV provided by the tree-based model (‘less than two out of the three questions’ → ‘less than two out of the three laboratory features’ → ‘less than three out of the four clinical features’) was 94.6%, based on 92 individuals.

