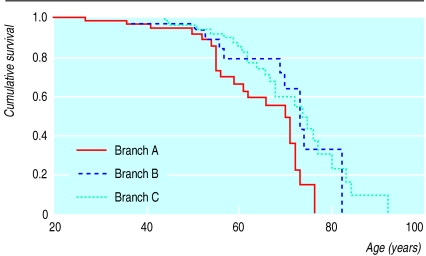
Figure 3.
Survival in the pedigree with V408M mutation. Data represent Kaplan-Meier estimates of family members with 0.5 probability of being affected. Branches A and C were ascertained through probands A and C, respectively. Life expectancy was significantly better in branch A than branch C (Logrank test P=0.001). Branch B differed from the other two with respect to the distribution of sex and time. Probands and first 20 years of life were ignored

