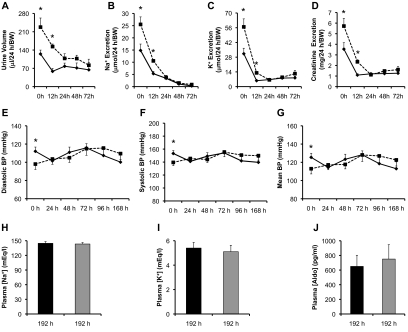
Figure 7.
Af17−/− and Af17+/+ mice show similar renal physiology and BP in a time-dependent manner on the low Na+ diet. Af17+/+ (solid line or dark bar) and Af17−/− (dotted line or gray bar) mice were fed the low Na+ diet (0.02% Na+) in metabolic cages and analyzed for the parameters before (day 0) and after treatment at various time points as indicated. For BP measurement, n = 17 to 21 mice/group. For all other parameters, n = 4 to 14 for Af17+/+ mice and n = 6 to 14 for Af17−/− mice. For additional parameters, see Supplemental Figure S4. In all cases, *P < 0.05 versus Af17+/+.

