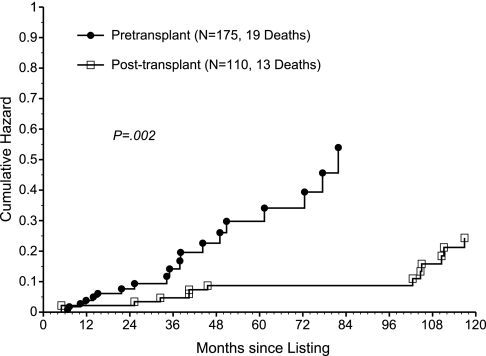
Figure 4.
The cumulative hazard rate of death due to a cardiovascular event post listing is significantly lower in the post transplant patients compared to those in the pretransplant state. Cumulative hazard plot of the hazard rate of death caused by a cardiovascular event after listing, using time-dependent covariate methodology to compare two patient states: pretransplant (n = 175, 19 deaths) versus post-transplant (n = 110, 13 deaths; P = 0.002).

