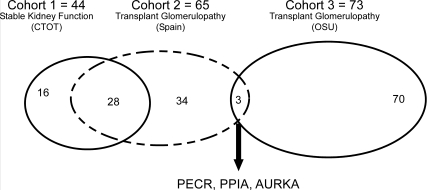
Figure 3.
Microarray analysis identifies three putative biomarkers for transplant glomerulopathy. Shown is a Venn diagram depicting the overlapping reactivities in sera from patients with stable kidney function (Cohort 1, left oval) and from two different cohorts of patients with TG (cohorts 2 and 3, middle dashed oval and right oval, respectively). Thirty-seven reactivities were found in cohort 2 but not detected in any of the cohort 1 patients. Of those 37 reactivities, three were also detected in each of the patients in cohort 3.

