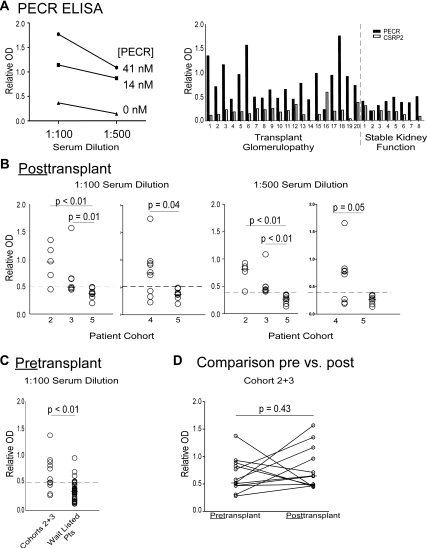
Figure 4.
Patients with TG specifically have serum antibodies reactive to PECR. (A) Anti-PECR ELISA. (Left panel) Serum from one representative patient with TG was diluted 1:100 and 1:500 and tested in an anti-PECR ELISA in which plates were coated with PECR (41 or 14 nM) or without PECR (0 nM). The mean values of triplicate wells are shown. (Right panel) Sera (1:100 dilutions) from 28 individual patients (20 with TG and eight with stable kidney function) were tested for reactivity to two PECR and a control protein, CSRP2 at 14 nM. (B) Anti-PECR reactivity detected post-transplant. Individual ELISA results for anti-PECR reactivity tested at 1:100 dilution (left panels) or 1:500 dilution (right panels) in patients with late TG (cohorts 2, 3, and 4) and stable kidney function (cohort 5). The wells were coated with 14 nM PECR. Arbitrary thresholds for positive values are shown by the dashed lines (OD 0.5 at 1:100 dilution and 0.4 at 1:500 dilution). (C) Pretransplant anti-PECR ELISA. Pretransplant sera obtained from patients with late TG (cohorts 2 and 3) and a randomly selected group of 37 patients on the transplant waiting list were tested for anti-PECR reactivity (1:100 serum dilution, 14 nM PECR). The dashed horizontal line represents the threshold of OD 0.5. Medians were compared by Mann-Whitney U test. (D) Individual pre- and post-transplant anti-PECR reactivity by ELISA. Each line represents the pre- and post-transplant serum reactivity for PECR for the 12 patients from cohorts 2 and 3 (extracted from panel C).

