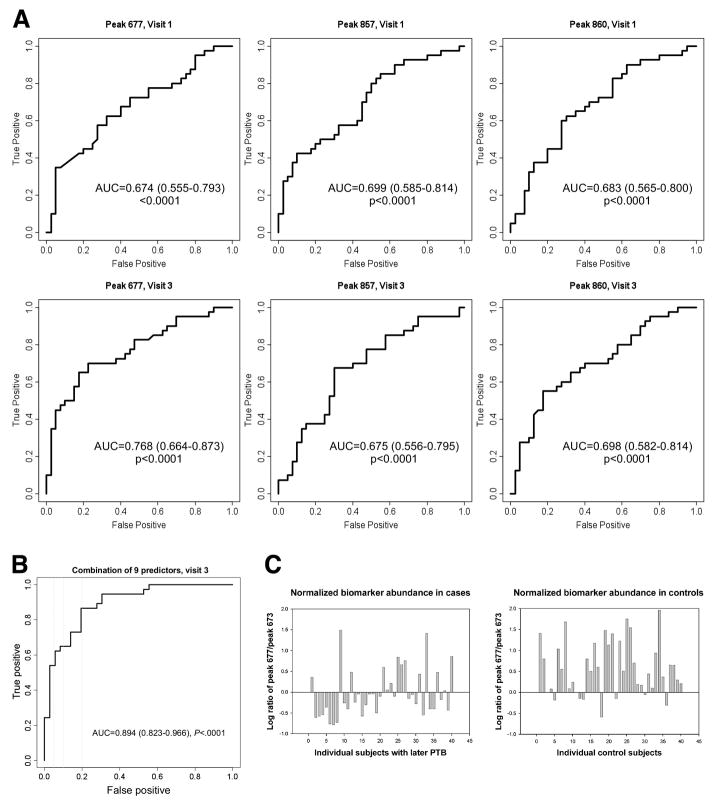
Figure 2.
A ROC curves demonstrating the predictive capability of 3 peptide markers to predict subsequent SPTB after sampling at 24 and 28 weeks. Area under the curve and 95% confidence intervals are also included for each marker at each visit.
B ROC curve demonstrating the predictive capability of the combination of 9 predictors including peak 677, peak 857, peak 860, corticotrophin releasing factor, defensin, ferritin, lactoferrin, thrombin antithrombin complex, and tumor necrosis factor – receptor type 1 to predict subsequent SPTB after sampling at 28 weeks. Area under the curve and 95% confidence intervals are also reported.
C. Normalized biomarker abundance was calculated for all individuals at 28 weeks. The graph shows biomarker (m/z 677) abundance in the sera of women having a subsequent SPTB or term delivery. Sixty five percent (26/40) of the women with subsequent SPTB had a value below the threshold whereas only 17.5 (7/40) percent of women with a term delivery had a value below the same threshold.

