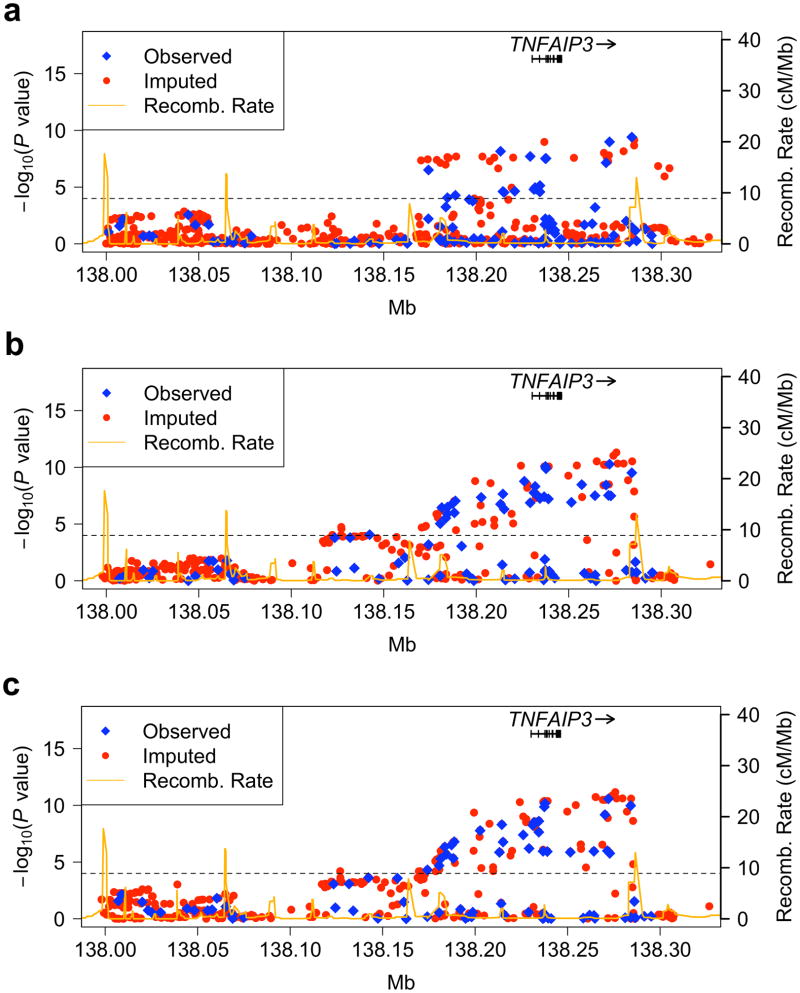
Figure 1.
SNPs in and around the TNFAIP3 gene associated with SLE in European-ancestry (a.), Asian (b.) and Korean (c.) populations. Genotyped SNPs are depicted with blue diamonds and imputed SNPs are shown with red circles. An orange solid line represents recombination rates across the region. The dashed line represents a Bonferroni corrected P < 1 × 10⁻⁴. Arrows identify SNPs demonstrating the most significant association results in each population.

