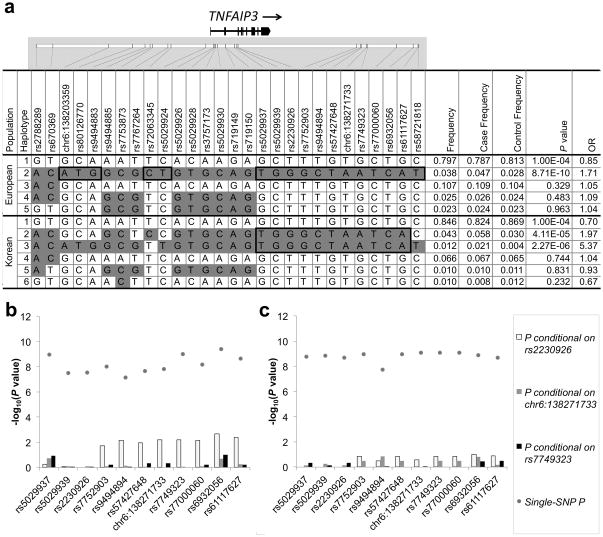
Figure 2.
Haplotype and conditional association analysis results of the TNFAIP3 risk haplotype. Haplotypes present at a frequency > 1% were compared in the European-ancestry and Korean populations (a.). Alleles in white boxes represent the major allele and those in grey boxes represent the minor allele for each haplotype. Black bold rectangles identify minor alleles that differentiate the SLE risk haplotype from the non-risk haplotype. Conditional association analysis was performed in the European (b.) and Korean (c.) populations for each of the SNPs within the 48.5 kb segment bounded by rs5029937 and rs61117627. We assessed three models: first, conditioning the on F127C coding variant rs2230926 (white bars), then conditioning on the TT>A variant (gray bars) and finally conditioning on rs7749323 (black bars).

